Intercepting the Windows 10 (1903) System Service call using the weakness caused by the dynamic trace support.
With recent major release of Windows 10 1903 (19H1), (My research build is 18362.175 which is released on June 11, 2019) Microsoft had brought an another great tool (dtrace) to the Windows natively. Unix like OS users are familiar to dtrace of course. If you don’t know anything about it, simply you can instrument/trace the apps or even OS itself’s function calls (syscalls) using it’s d lang scripts.
As I mentioned above you can get a notification before or the after the syscall. dtrace has probes for each type of tracing. Syscall entry or return probes are couple of them for example. In case of syscall probes, to able to achieve syscall entry/return tracing, the OS should provide a support mechanism for this feature within the kernel. Of course, Windows does it that way too.
But this feature brings very comfortable system call hooking technique for the rootkits without trigger the patchguard’s protection mechanism even the dynamic trace feature is off.
But before I show you how can be achieved that, I have to explain the dynamic trace mechanism first. But if you just want to see how system calls can be intercepted just click here to jump that section.
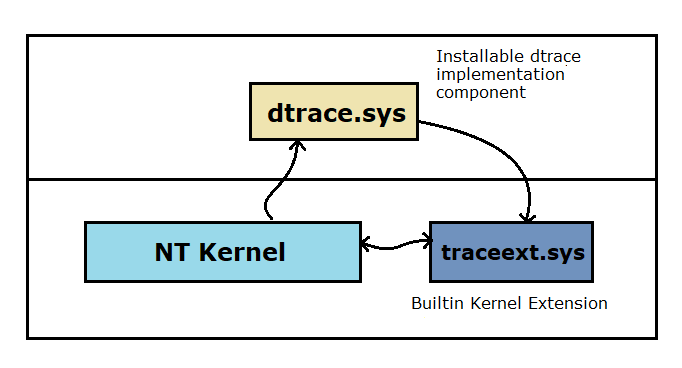
Dynamic trace’s core mechanism has implemented in the NT kernel inside. That part provides primitives of the dynamic trace to an upper level implementation. And the kernel can protect these core structures. The upper level dynamic trace implemented in the traceext.sys which is a kernel extension of the NT. This extension linked to the kernel image via Windows API set mechanism. If you don’t know anything about Api sets you can follow this link to learn more (https://docs.microsoft.com/en-us/windows/win32/apiindex/windows-apisets)
Basically, api sets improves portability and modularity of the executables. Windows NT’s executable image (ntoskrnl.exe) is one of them. So the kernel itself could become purified from the things that are not needed to be in the kernel. For example, nowadays Windows NT implements it’s transaction manager as an extension (tm.sys)
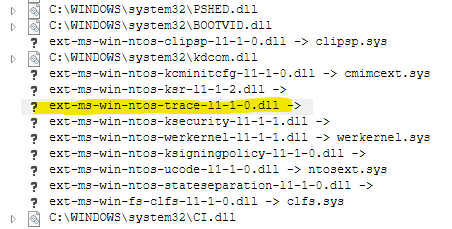
You can see many api sets based extension import dll of the ntoskrnl.exe above. But as you noticed, some of them exposes their host implementations, some of them are not. Api sets mapping data contained by the apisetschema.dll and the image loader maps these mock import into the real implementation host dll. I won’t describe how Apisets works. That is not this article’s subject of course.
The dynamic trace support implementation points to “ext-ms-win-ntos-trace-l1-1-0.dll”. But as you seen the picture above the highlighted trace mock import wasn’t exposed. Because the apisetschema.dll does not contain host implementation info for this. So the NT boot loader does something special for that entry.
The NT image loader (winload.exe) handles that special operation. Winload.exe is responsible to take control from the very early boot sequence and prepare a beautiful and comfortable place for the kernel itself. Winload.exe has also it’s own Api set mapping routines. One of these is OslLoadApiSetSchema. the OslLoadApiSetSchema prepares apiset mapping data for the NT kernel image before the actual kernel initialization.
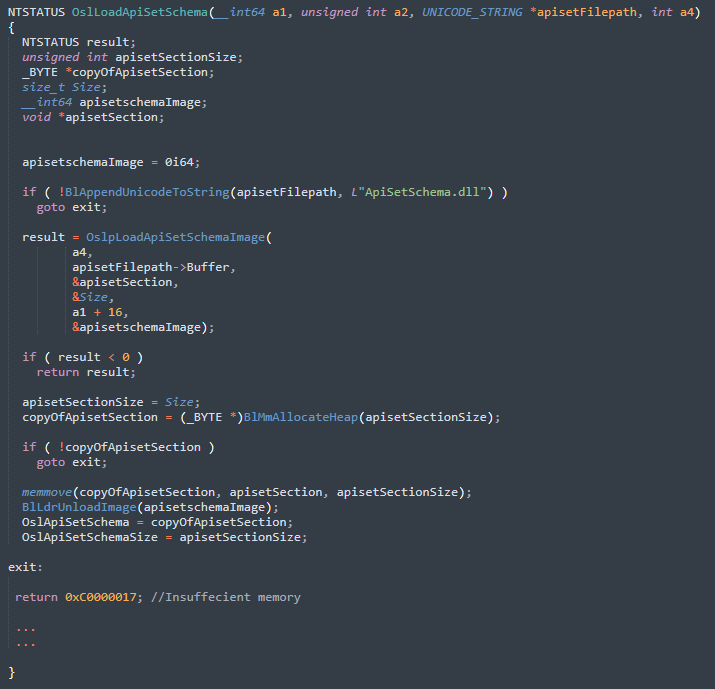
OspLoadApiSetSchemaImage maps the apisetschema.dll into the memory, finds the section named “.apiset” and returns the section, it’s size and mapped dll image. It copies entire section into another dynamic memory place, then unloads the apisetschema.dll which is no longer needed.
In winload.exe, there is a special table for the apiset schema to getting loaded dynamically during the boot.
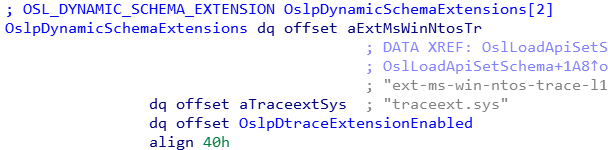
OslpDynamicSchemaExtensions holds the information of the mock imports to be loaded dynamically. This table has basic struct and undocumented, but it can be documented as follows
typedef BOOLEAN (NTAPI *POSL_CHECK_ROUTINE)(PVOID, POSL_DYNAMIC_SCHEMA_EXTENSION);

typedef struct __OSL_DYNAMIC_SCHEMA_EXTENSION
{
	PWCHAR              MockDllStrongName;
	PWCHAR              HostImplementationFilename;
	POSL_CHECK_ROUTINE  MapConditionCheckRoutine;
}OSL_DYNAMIC_SCHEMA_EXTENSION,*POSL_DYNAMIC_SCHEMA_EXTENSION;
First field is quite clear, that points the mock dll strong name, second is holds the actual implementation file (that’s traceext.sys in our case). The third one is a decision routine that it whether the mock import to be mapped or not.
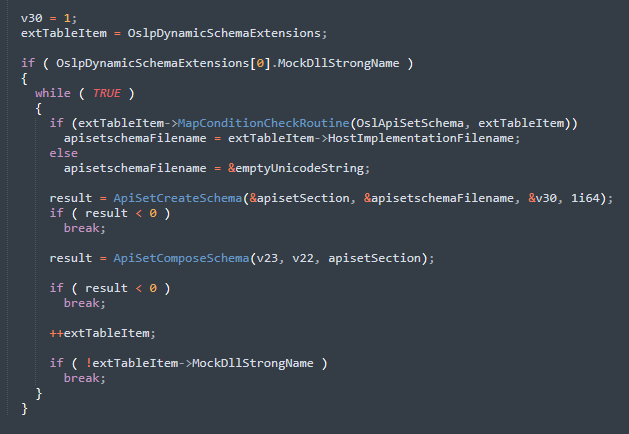
It simply first checks the table’s first entry. If mock import dll isn’t null that means there some dynamic map context. So it starts a loop until hits NULL record of the table. This portion of the code calls the decision routine with passing the table item and the apiset schema. Check routine checks the conditions to be met. (In case for traceext.sys, the rule is dtrace flag should be set to “on” via bcdedit)
If the conditions met, it gives the host implementation filename and the process goes on. That part may seen unnecessary to describe for some, but I wanted to explain to the possible questions about “Ok, ext-ms-win-ntos-trace-l1-1-0.dll’s doesn’t expose its implementation, but how did you know that the traceext.sys is the host implementation of it?” If you are one of them, now you know the what the reason is. 😃
Traceext.sys has two exported functions related with the initialization.
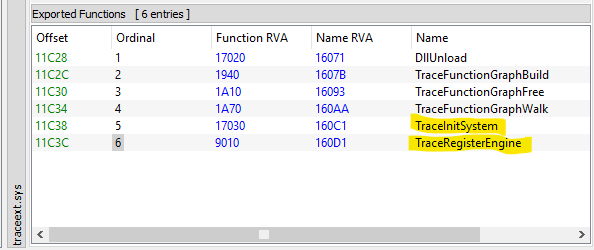
TraceInitSystem exchanges some information between traceext and the kernel itself during the kernel initialization. And the TraceRegisterEngine is used by the dtrace.sys to letting the traceext.sys (of course, as an indirect way to the kernel either.) know the tracing implementation module is dtrace itself.
Initialization process of the dynamic trace support
Dynamic trace initialization is one of the very early processes of the kernel init. Dynamic trace init process is part of the phase1 kernel initialization.
Phase1InitializationDiscard
KeInitSystem(1)
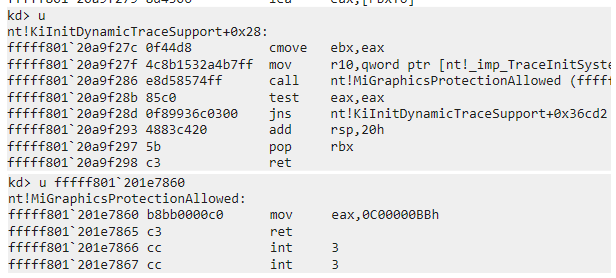
KiInitDynamicTraceSupportKiInitDynamicTraceSupport is an internal function that responsible for dynamic trace init.
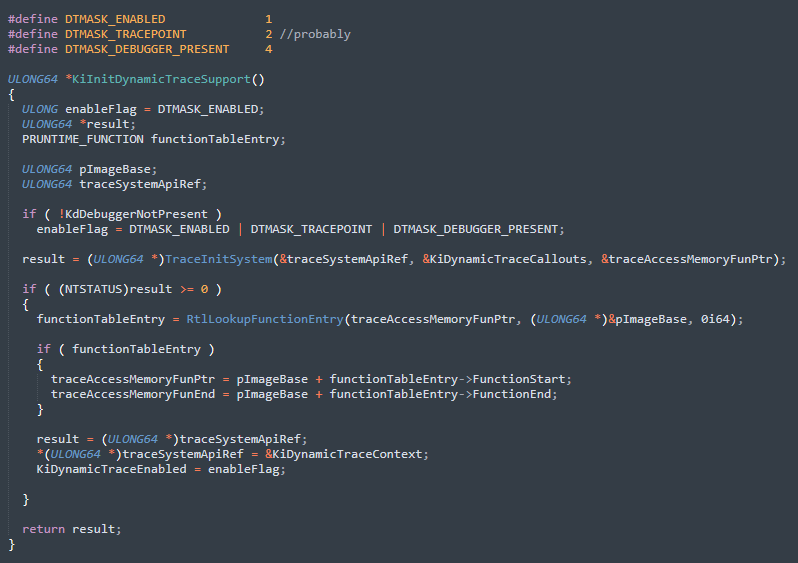
The initialization function first checks whether there is debugger exists or not. If debugger present it sets all possible dynamic trace mask to KiDynamicTraceEnabled global variable. As you can see KiDynamicTraceEnabled is not a boolean value. It holds many feature bits about the dynamic trace. I had documented these bit fields as follows.
#define DTMASK_ENABLE             1
#define DTMASK_TRACEPOINT         2 //probably
#define DTMASK_DEBUGGER_PRESENT   4
Then it calls traceext’s init api named TraceInitSystem as I mentioned before.
TraceInitSystem takes 3 parameters. First one is an output parameter, traceext.sys gives it’s memory location to be filled with the KiDynamicTraceContext to the kernel.
KiDynamicTraceContext is a struct that holds information about the kernel and it looks as follow.
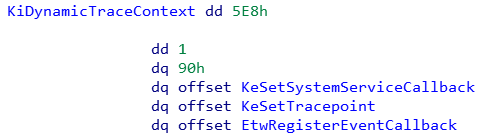
4th field points to a kernel function named KeSetSystemServiceCallback. That function is used by the traceext.sys to register a callback for desired system calls. 5th and the 6th fields holds another two kernel functions for different purposes. These are not important for my interest. My major interest is KeSetSystemServiceCallback obviously. 1st and the 3rd fields are essentially an offset value for KTHREAD struct. So why? Because traceext.sys is uninformed about the kernel structures. KTHREAD’s offsets or field orders can be change of course. With these information, traceext.sys will be informed about the KTHREAD’s required field locations. So what are these offsets points to? When we examine the KTHREAD’s struct, we can see the offset of 0x5E8 points to TracingPrivate field.
kd> dt _KTHREAD TracingPrivate
nt!_KTHREAD
   +0x5e8 TracingPrivate : [1] Uint8B
That’s obviously related with the trace support. That field holds address of the internal trace information of the being traced thread. 2nd field of the KiDynamicTraceContext’s probably a limit value.
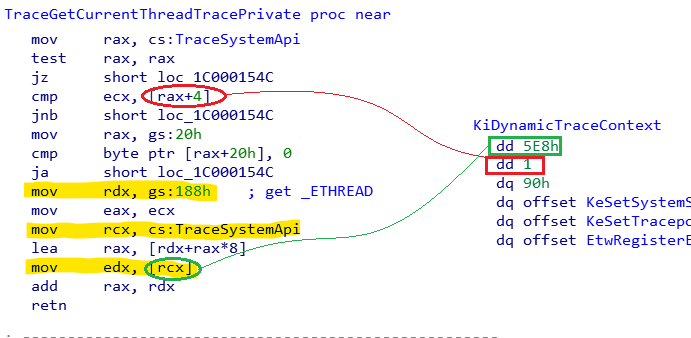
For example, traceext.sys has a function named TraceGetCurrentThreadTracePrivate, that function obviously returns value of the traceprivate field of the current thread I mentioned before. As you see the green mark gets the TracePrivate section using the KiDynamicTraceContext’s first field value. Also as you noticed, the red marked path compares the 2nd field. If passed parameter to the TraceGetCurrentThreadTracePrivate is not below than KiDynamicTraceContext’s 2nd field, the function exits. In the case we talked about, the passed parameter should be zero, so lea rax, [rdx+rax*8] instruction always gives us the address of the KTHREAD. That may seen meaningless but maybe thats for future usage I don’t know.
The 3rd offset also points to TrapFrame field of the KTHREAD.
kd> dt _KTHREAD TrapFrame
ntdll!_KTHREAD
   +0x090 TrapFrame : Ptr64 _KTRAP_FRAME
KeSetSystemServiceCallback is important for us, so I will detail later.
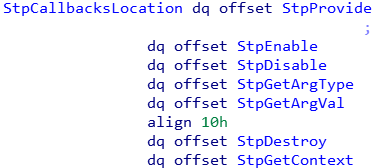
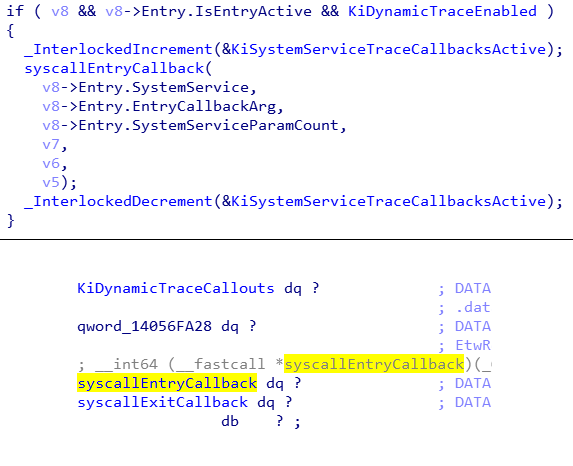
Let’s back to TraceInitSystem. It’s second parameter is a kernel memory reference named KiDynamicTraceCallouts. This table holds some callback functions of the traceext.sys. This time, the traceext gives out some information to the kernel. NT kernel passes it’s memory reference to the traceext.sys through the TraceInitSystem. The traceext.sys fills the table with it’s callback functions. The KiDynamicTraceCallouts built with 8 elements. And the traceext.sys fills out it as follows
ULONG64 KiDynamicTraceCallouts[8]
{
	NULL,       //first element of the table was set to NULL.
	DtEtwpEventCallback,
	StpCallbackEntry,
	StpCallbackReturn,
	FbtpCallback,
	FbtpCallback,
	FtpPidCallback,
	FtpPidCallback
}
There are many callbacks for different type of dtrace providers. For example Fbt prefixed callbacks are for FBT (Function boundary tracing) provider of the dtrace. So, StpCallbackEntry and StpCallbackReturn are for syscall provider callbacks. They are known as probe in the dtrace world. Entry probe is used before the system call occurs, and return probe after the system call occurs.
KiDynamicTraceCallouts is protected by the patchguard. So any attempt to modify this table eventually ends with a bug check. The 3rd parameter of the TraceInitSystem is traceext.sys’s function that does simple memory copy. So it’s not worthy to talking about it.
If TraceInitSystem succeeds, the KiDynamicTraceEnabled global variable is set to the flag that was previously arranged at the beginning of the KiInitDynamicTraceSupport. Note that, the KiDynamicTraceEnabled is also protected by the patchguard.
If dynamic trace support is disabled, TraceInitSystem redirected to a stub which returns STATUS_NOT_SUPPORTED. So the initialization would be failed.
KeSetSystemServiceCallback
KeSetSystemServiceCallback is an undocumented kernel function to set a legitimate callback function to be called during the system service dispatch. Remember, that function was passed to the traceext.sys to set a system service callback via the KiDynamicTraceContext. Let’s take a look what this function does.
KeSetSystemServiceCallback is undocumented function, but after a while I documented this function as follows
NTSTATUS NTAPI KeSetSystemServiceCallback(
   PCHAR syscallString,
   BOOLEAN isEntry,
   PVOID callback,
   PVOID cbArg
)
This function checks the callback parameter using the KiDynamicTraceCallouts table first. That means only legitimate callbacks can be set as the system service callback.
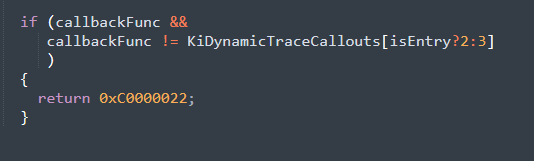
If supplied callback value is not one of the legitimate Syscall trace callback (StpCallbackEntry, StpCallbackReturn) it fails with STATUS_ACCESS_DENIED. This tries to prevent to set unwanted system service callback. Remember that the KiDynamicTraceCallouts is protected by the patchguard and it was initialized during the system boot. If isEntry parameter is TRUE it checks for StpCallbackEntry which is the 2nd index, otherwise looks for StpCallbackReturn which is the 3rd index of the callout table.
If the callback to be set is one of the valid ones, the execution passes to the registration logic. Then the function gets the tracing table. For that job there is an internal kernel function named KiGetSystemServiceTraceTable. This function returns the system service trace table to the caller. If the trace table is NULL, then it builds the table.
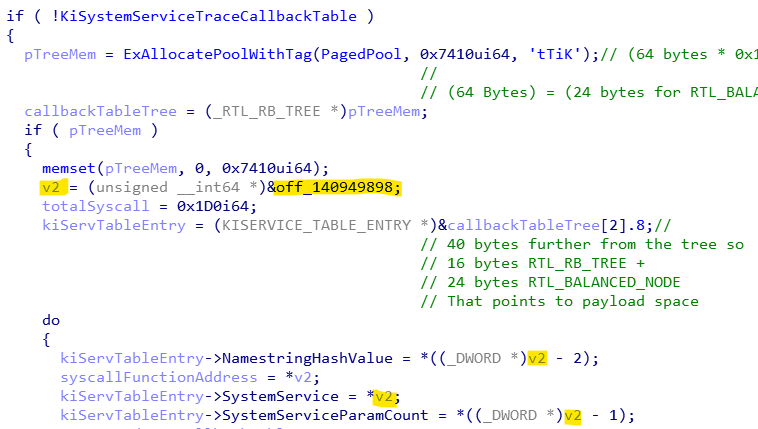
If the table variable is NULL, the function allocates memory from the paged pool first with a tag (KiTt). Its memory size depends on the total system call count. It allocates 0x7410 (29712 in decimal) bytes of memory.
This table is an array actually, but in order to do faster lookup on the table, it builds a red-black tree using this array. That means the allocated memory should include extra byte sizes for the red-black tree node and the tree itself. So we can take apart the allocation size into
16 bytes for _RTL_RB_TREE
There are 464 (0x1D0) system calls
64 bytes for each system call so
(0x1D0 * 64) bytes for system call context
64 bytes consisted size of the _RTL_BALANCED_NODE and the payload space.
(24 bytes for _RTL_BALANCED_NODE and the remaining 40 bytes for the payload context)
So 16 + (464 * 64) gives us the allocation size which is 0x7410 (29712) bytes.
that can be formulated as
TableSize = sizeof(_RTL_RB_TREE) +
(TotalSystemCallCount * (sizeof(_RTL_BALANCED_NODE) + PayloadSize))
The memory layout of the system service trace table can be visualized like so;
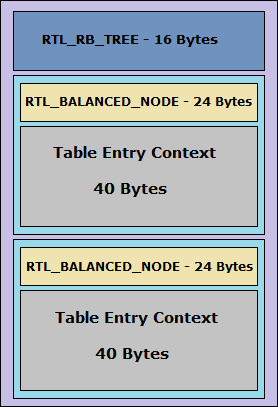
Table entry context is undocumented data structure and it holds information about the system service callback to be set. I documented that space during the reversing process as follows.
struct KISERVICE_TABLE_ENTRY
{
ULONG64 SystemService;
ULONG SystemServiceParamCount;
ULONG NamestringHashValue;
BYTE IsEntryActive;
BYTE IsReturnActive;
USHORT Unknown1;
ULONG Unknown2;
ULONG64 EntryCallbackArg;
ULONG64 ReturnCallbackArg;
};
struct KISERVICE_TABLE_CONTEXT
{
RTL_BALANCED_NODE Node;
KISERVICE_TABLE_ENTRY Entry;
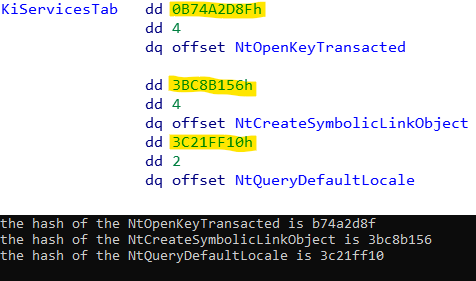
};So this table is generated using a pre-built static table named KiServicesTab. Probably, this static table had auto-generated during the NT kernel compilation. If you take a look the screencut above, you must be noticed that there is a highlighted offset value. When we get there, we can see the KiServicesTab. This offset points to the first system service function address of the table. But actually the table begins from the KiServicesTab.
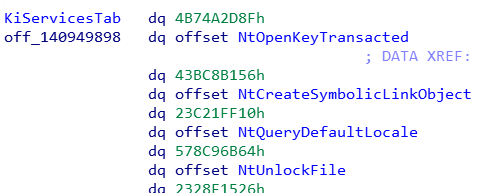
But if we look into the table build code, the first qword field of the table which looked above, actually consists of two different dword value. So that becomes to this
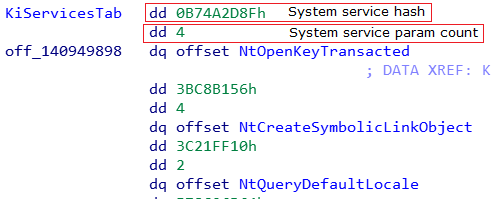
So the table’s item structure can be documented as follows
typedef struct __KISERVICESTAB_ENTRY
{
	ULONG    SystemServiceNameStringHash;
	ULONG    ParameterCount;
	ULONG64  SystemService;
}KISERVICESTAB_ENTRY, *PKISERVICESTAB_ENTRY;
So how did I know the first value is a hash value. Let’s back to KeSetSystemServiceCallback’s implementation. But before I get back to it, the remaining implementation of the KiGetSystemServiceTraceTable is an ordinary red-black tree encoding and the insertion operation. So I won’t explain that part.
After getting the trace table, KeSetSystemServiceCallback computes the hash value for it’s first parameter.
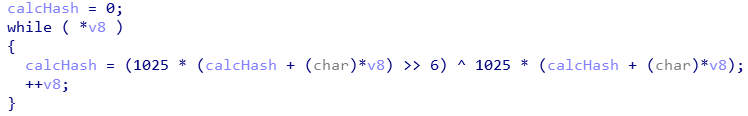
That quite clear that is a null terminated string loop pattern. It loops through the string and calculates a hash value using a simple hashing algorithm shown above. After then it loops through the service trace table until the computed hash value equals to the one of the table entry. This hash algorithm hashes the system service name but with a bit difference. 😊 I’ll explain that later.
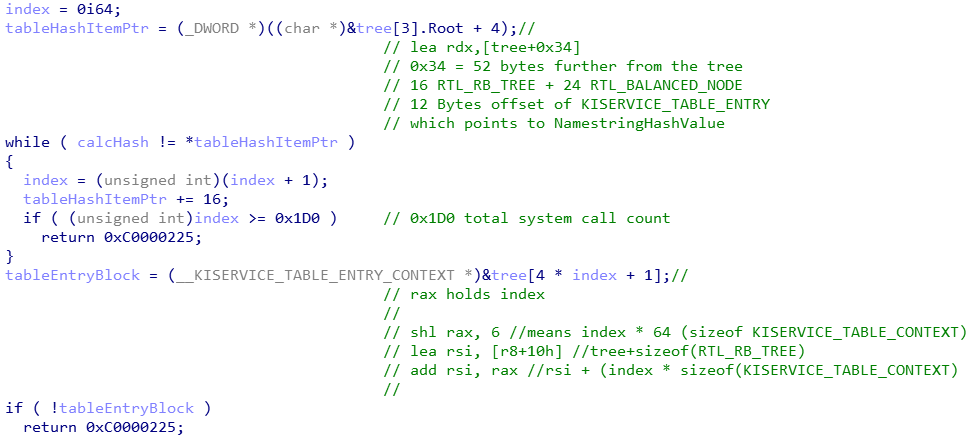
When the hashes matched, it gets the KISERVICE_TABLE_CONTEXT block using the index value and fills the KISERVICE_TABLE_ENTRY struct with the necessary data.
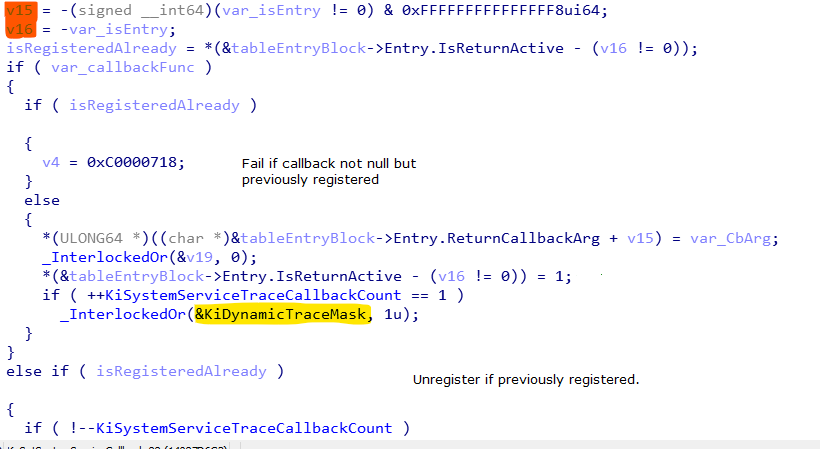
As you might noticed the highlighted variable named KiDynamicTraceMask set on the initial callback registration. KiDynamicTraceMask used to determine whether there is an active trace callback or not by the system service dispatcher.
A side note: v15 and the v16 that marked with orange color are side effect of a compiler optimization, they are depends the isEntry parameter and these are used to move back or forth through the adjacent fields for both the Entry or Return probe info in single operation.
The Dynamic trace in perspective of the Traceext.sys
traceext.sys acts as a bridge between the kernel and the dtrace.sys implementation. It exchanges the information with both of the kernel and dtrace.sys. And it helps to communicate between them using dynamic trace mechanism. When the dtrace.sys gets loaded into the kernel, first it needs to register itself to the traceext.sys either. To do that, it uses the TraceRegisterEngine of traceext’s as you might remember. Let me explain the sequence of the dtrace’s engine registration.
- When dtrace.sys gets loaded, it calls the TraceRegisterEngine function with the engine function table of the dtrace.sys as a parameter to let the traceext.sys know.
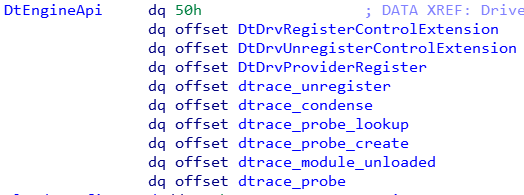
- traceext!TraceRegisterEngine sets it’s global variable named TraceEngineApi to address of the engine function table.
- Then the tracext!TraceRegisterEngine calls traceext!prov_systrace_init which is one of the dtrace provider initialization functions
- prov_systrace_init calls dtrace!DtDrvProviderRegister function using the engine table (TraceEngineApi) that it was set on the previous step. prov_systrace_init passes it’s operation function table to the dtrace!DtDrvProviderRegister. it calls the dtrace_register and it does its final job. So the dtrace knows the tracing operation API.
After these operations the dtrace and the traceext had been successfully exchanged their APIs between them and the dtrace module is ready to drive the dynamic tracing.
dtrace module first uses the StpProvide to build it’s internal system call information structures.
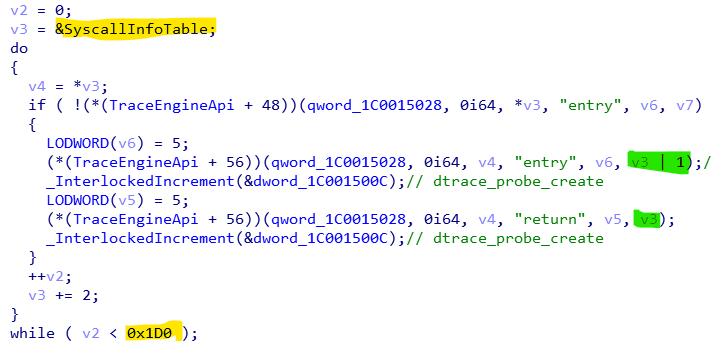
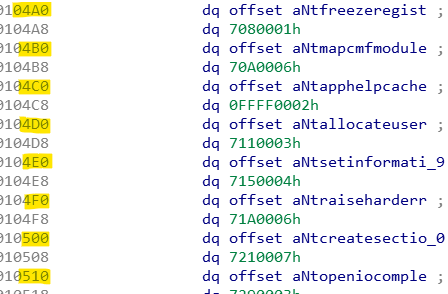
StpProvide loops through the traceext’s internal system service info table and calls dtrace!dtrace_probe_create to build dtrace’s internal structure for each system service function. The system service information table structured as follows
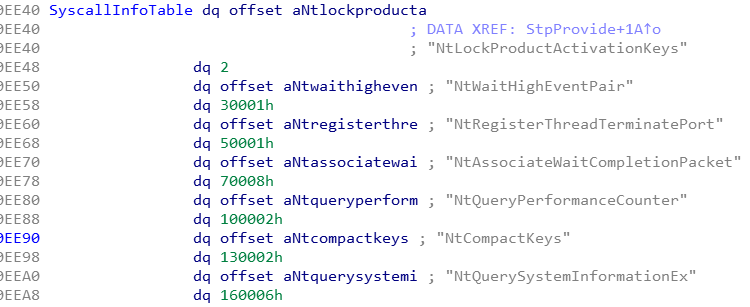
As you can see this table holds the system service names as string. Did you remember that the KeSetSystemServiceCallback was calculating a hash value from it’s first string parameter? These are the target of the hash algorithm. The second QWORD field of the table is actually holds two different properties. We can think the structure of the entry of the table as
struct SYSCALL_INFO_ENTRY
{
	PCHAR SystemCallNameString;

	struct {
		ULONG64 ParamCount : 16;
		ULONG64 ProbeId : 48; //probably
	}Info;
}
The first 16 bit portion of the QWORD holds the parameter count of the system service function. Remaning 48 bit probably is for the probe id value. Ok, lets get back to StpProvide’s implementation.

That loop takes the string reference one by one from the table. And as you remember it was calling the dtrace_probe_create function. These green marked parameters are references for the system service name strings. But as you might noticed, the string reference value passed as it’s LSB (Least significant bit) is set for the entry callback. That bit used to determine whether the callback registration is for the entry or the return. You might think that this does corrupt the address value but it does not. Because the Syscall name string offsets were placed into a tricky addresses.
The trick is the LSBs of the string offsets are always zero. So the identification mark bit does not conflicts with the original address value. I don’t know why they done it such a thing. 🤷🏽♂️
Let’s take a look the StpEnable. StpEnable was used by the dtrace to set the entry or the return callback for the system calls.
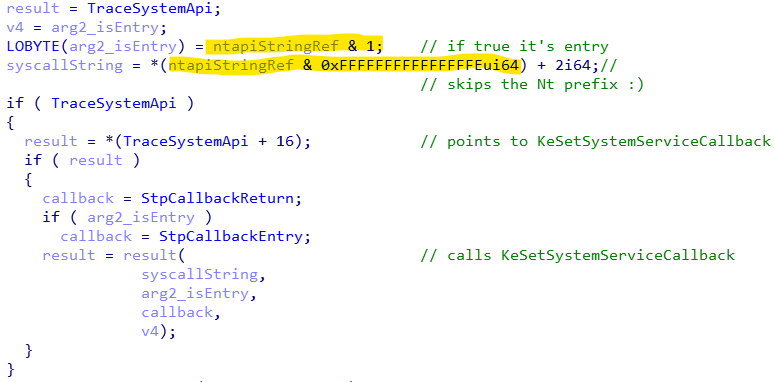
As you seen the StpEnable checks the LSB of the name string pointer to identify the callback type. Then it clears the LSB of the string address and adds 2 to it. That skips the first two characters from the begginning of the string. We already know that the string is for the system call names. That means StpEnable skip the “Nt” prefix from the system service name string.
Here is a simple test program
ULONG CalculateHash(PCHAR syscallName)
{
    ULONG hash = 0;
    PBYTE p = syscallName + 2;

    while (*p)
    {
        hash = (1025 * (hash + *p) >> 6) ^ 1025 * (hash + *p);
        p++;
    }

    return hash;
}

int main(int argc, char **argv)
{
    PCHAR syscalls[] =
    {
        "NtOpenKeyTransacted",
        "NtCreateSymbolicLinkObject",
        "NtQueryDefaultLocale"
    };

    for (int i = 0; i < sizeof(syscalls) / sizeof(PCHAR); i++)
    {
        printf("the hash of the %s is %lx\n",
            syscalls[i],
            CalculateHash(syscalls[i])
        );
    }

    return 0;
}
So if we want to set a system service callback we have to pass the syscall name without the Nt prefix.
Dispatching the system service callback
During the system service dispatch, the dispatcher checks there is an active system service callback. To do that the dispatcher routine (KiSystemCall64) uses the KiDynamicTraceMask. As I mentioned before, this global variable was setting when you register a system service callback for a first time via the KeSetSystemServiceCallback.
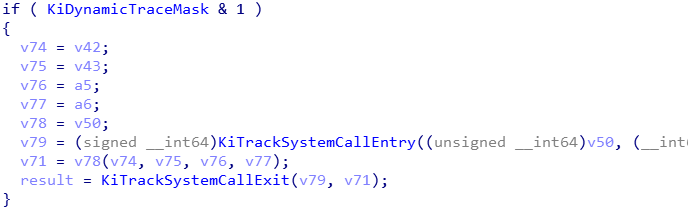
KiTrackSystemCallEntry and the KiTrackSystemCallExit gets called for entry and the return callback respectively. System service function gets executed after the KiTrackSystemCallEntry’s job done.
KiTrackSystemCallEntry executes the legitimate callback function which placed at the KiDynamicTraceCallouts.
Weakness of the system service callback dispatching and using it to intercept system calls
Dynamic trace takes help from the patchguard to protect it’s key struct and variable but that’s prevent abusing the dynamic trace in official way only. So you can’t set your own callback or enable the dynamic trace on the fly. But these are could be achieved with some tricks. Of course there is no problem with that approach. Protecting the key structures with the patchguard is sufficient method . But the rootkits tries to do anything they can. Therefore, one of duty of the patchguard is prevent interception of the system calls.
The main problem is the system service dispatcher trust the context after the system service callback dispatch.
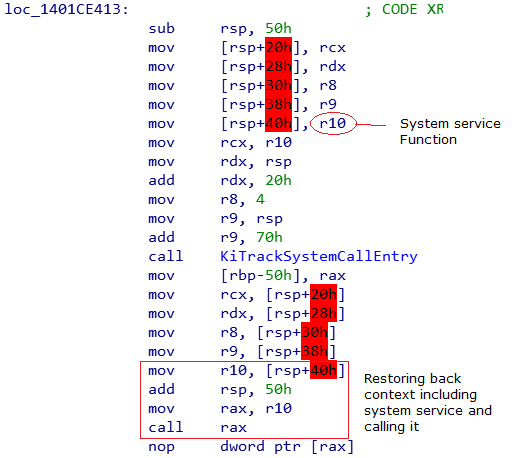
System service dispatcher saves it’s context to preserve them before the KiTrackSystemCallEntry, and restores back after it. That is necessary in order to make function calls work of course. But when the subject is about delivering the system service, that needs some special care. Because that could give an exploitation opportunity to a malicious code such as rootkits. Stack area can be modified by the being executed callback. Microsoft thinks that’s never gonna happen because they assume that only the legitimate callbacks can be executed. Remember the callbacks are under the protection of the patchguard.
As you seen above, being saved context includes the original system call address. If the being executed callback changes the original system call address with a hook routine on the stack, the hook routine will be called instead of the original one.
Now I will show how that can be done.
Hooking the system calls
Preparing our hook system is quite easy. We need to patch just for 4 key points. Three of them are about simply reversing the comparison logic.
Patching KeSetSystemServiceCallback
The only validation of KeSetSystemServiceCallback is comparing the callback function with the corresponding KiDynamicTraceCallouts entry. After patching the single byte conditional jump, we can register a syscall callback as we wish. And the beautiful side of the KeSetSystemServiceCallback is if the system service callback table is null during the registration, it builds the entire system service callback table via KiGetSystemServiceTraceTable. We don’t have to do any additional thing. That makes our job much more easier.
Patching KiTrackSystemCallEntry
KiTrackSystemCallEntry has two check-points to be patch.
1) Is the Dynamic trace support enabled
2) Whether the callback function is allowed to be called.
These check points can be handled with a single byte patch. Quite easy.
As I mentioned before, the KiTrackSystemCallEntry was calling the entry callback that belongs to the KiDynamicTraceCallouts.
But we have to redirect it or replace it with our hook handler. Replacing would be easy and reliable choice to me. First I have to find a location to plant my hook handler routine. After a bit looked around I choose an unused place for it.
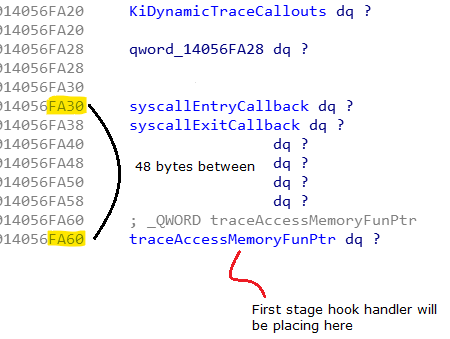
That place is 48 byte far from the legit callback location. as close as can right? The place I choose is used when the dynamic trace is actively used. So that location can be counted as unused. Of course that place can be different.
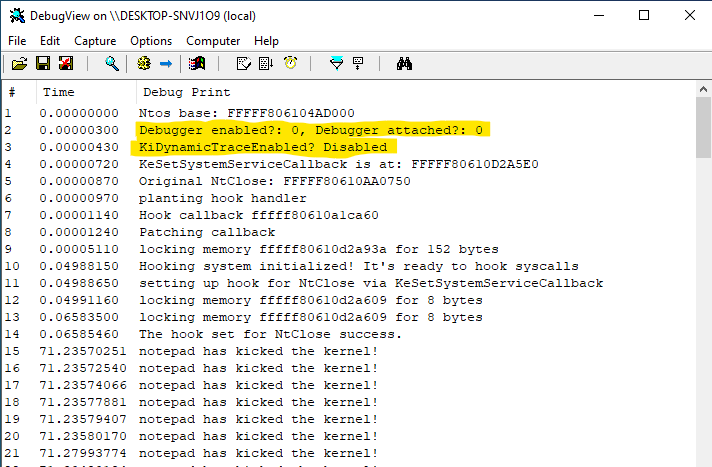
We just prepared the hooking system with 4 simple patches. After then the kernel system calls are ready to be hooked. We just simply use the KeSetSystemServiceCallback.
for example
//setting a hook for NtClose
KeSetSystemServiceCallback("Close",TRUE,Myhook,NULL);
That’s all. When a system call (NtClose in the case) occur, our hook handler will be called instead of the legit callback. the hook handler will be replacing the original system call with the system call hook implementation. After then the hook implementation will be calling eventually.
You can access the P.O.C code from my github repo.
https://github.com/0ffffffffh/system_call_hook_win10_1903
Final thoughts
This weakness gives very comfortable hooking technique to the rootkit developers. Because they can set a hook what they want specially. For example, you can set a hook just for NtClose with a single call then you get only the NtClose hook callback. Quite simple, comfortable and manageable.
But Microsoft don’t believe that would be an issue. On August 2nd, I disclosed my findings to MSRC with a P.O.C that shown system calls being intercepted without triggering the patchguard’s defense mechanism against the system service hook. That’s the one of the prevention duties that the patchguard have to do.
After a couple days, they said this issue does not meet the bar for the immediate servicing and it won’t be fixed in the next release and they pointed that the first P.O.C I sent depends to the dtrace feature is on. But I was told them whether the dtrace is on or off would not matter. I just wanted to focus main problem with this issue. Then I sent them another P.O.C that is intercept the system service calls even the dtrace feature is off and I informed them in detail with this blog post content.

They said that they will review my additional information and let me know if they have any updates. So I decided to keep it private for a while in order to let them make possible final decision on this issue. I had sent this post on August 26th to them. I have not received any notification that this issue worth to be dealt with. So I made it public.
If this is not an issue, why there are many kernel mode protection mechanisms such as patchguard exist? That is obviously bypasses the patchguard protection against the system service hook. If an attacker could intercept the system calls, there is no meaning existence of those protection technologies and those are remains quite unusable.
I think this is fixed now in 1909 (triggers PG).
Hey there,
“Project” stood out as possibly a spelling mistake. I’ve used spellradar.com before to quickly confirm.
Cheers,
Jonathan
Just saw “Project”, possibly misspelled. spellhelper.com usually confirms these quickly.
Regards,
Jessica
Just saw “Project”, potentially misspelled. Quickly checking with spellalert.com usually helps.
Thanks,
William